
oko In use
One page for every self-hosted service, with its status and 30-day uptime from gatus.
You list your services in one JSON file. oko renders them as one searchable page, and for each service that gatus watches, it shows whether it is up and its uptime over the last 30 days.
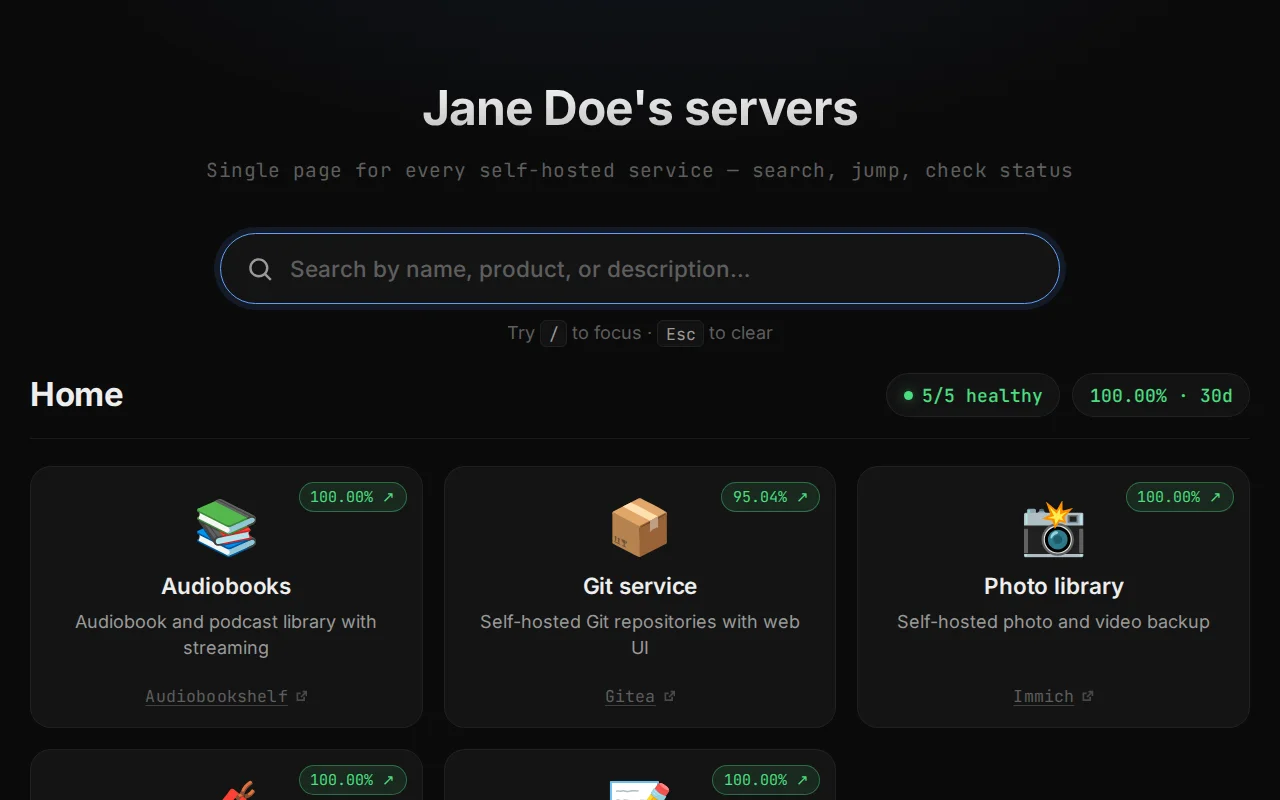
From config to card



Up, down and 30-day uptime come from gatus.
The card gets a red border and keeps its 30-day uptime from gatus.
When gatus gives no answer for a service, the card gets a dashed "unknown" marker instead of a red border, and the section counter reports it separately. Failed upstream is not the same as failed service.
{
  "name": "Audiobooks",
  "url": "https://books.${DOMAIN}",
  "icon": "\ud83d\udcda",
  "description": "Audiobook and podcast library with streaming",
  "product": "Audiobookshelf",
  "product_url": "https://www.audiobookshelf.org/",
  "endpoint": "home_audiobookshelf",
  "gatus_host": "uptime-cloud"
}
Change config.json and the next page load shows it. No restart, no database, no accounts.
name— the card's title. Required.url— where the card links.${DOMAIN}is replaced with theDOMAINenv var. Required.icon— any emoji or short text.description— the line under the title.product+product_url— a small attribution link below the description, only whenproduct_urlis set.endpoint+gatus_host— the gatus lookup. Set both or neither; with neither, the card has no status pill.
What it is not
- Not a status page generator.
- Not a metrics dashboard: oko reads gatus badges.
- Not a gatus replacement.
- Not a health-check tool: oko never probes services itself.
Quick start
# compose.yml
services:
  oko:
    image: ghcr.io/spy4x/oko:latest
    restart: unless-stopped
    ports: ["8080:8080"]
    environment:
      DOMAIN: example.com                # replaces ${DOMAIN} in service URLs
      UPTIME_HOSTS: uptime.example.com   # your gatus host(s), comma-separated
      CONFIG_PATH: /config/config.json
volumes: ["./oko:/config:ro,z"]{
"title": "Jane Doe's servers",
"servers": [
{
"name": "Home",
"services": [
{
"name": "Photos",
"url": "https://photos.${DOMAIN}",
"icon": "\ud83d\udcf7",
"endpoint": "home_photos",
"gatus_host": "uptime"
}
]
}
]
}Save the second block as oko/config.json, run docker compose up -d and open http://localhost:8080. endpoint is the gatus endpoint's key, and gatus_host is the first label of a host in UPTIME_HOSTS.
Use it if
- You run gatus and want one friendly page for your self-hosted services.
Skip it if
- You need a public status page, metrics graphs, or a tool that probes services itself.
Two ways to use it
Use it yourself
The code is on GitHub under the MIT licence.
Have me build it
Need something like this for your team? That's my day job.